Alternative Data Trends For the Magnificant 7 Stocks
In 2023, the technology sector witnessed a resurgence, particularly embodied by the ‘Magnificent Seven’ – Alphabet, Amazon, Apple, Meta Platforms, Microsoft, Nvidia, and Tesla. Articles from The Wall Street Journal and The New York Times recently reported on this trend, showcasing how these tech giants have collectively added over $5 trillion in market value in 2023, significantly influencing the S&P 500’s record highs.
The Wall Street Journal’s analysis reveals a blend of investor optimism and caution, highlighting the significant market capitalization of these firms and their resilience in uncertain economic times. Key factors driving this growth include Federal Reserve policies and the potential for advancements in artificial intelligence.
On the other hand, The New York Times article underscores the massive 117% collective growth of these stocks since October 2022, dwarfing the performance of the other 493 companies in the S&P 500. The disparities in individual performances of these companies, like Nvidia’s 417% rise, illustrate the varied trajectories within this elite group. However, their combined dominance also raises questions about broader market health and volatility.
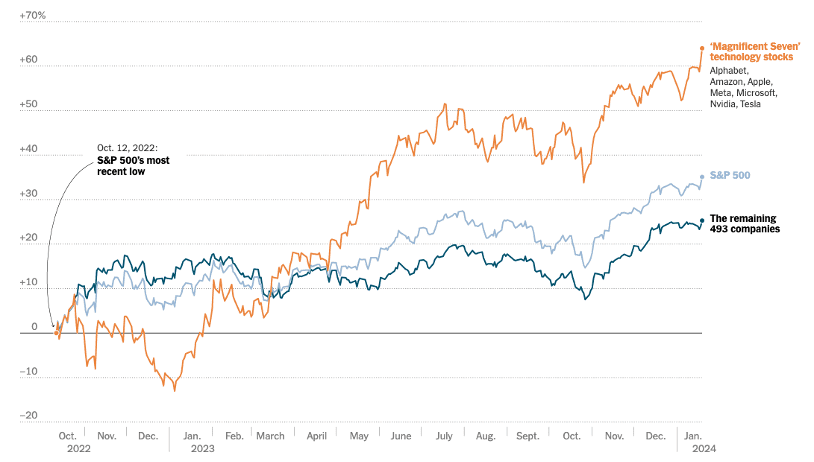
Figure 1: Change in total market value since October 2022 (Source: New York Times/FactSet – Data is as of market close on Jan. 19th, 2024)
As part of Eagle Alpha’s January Next Level Conference, on Thursday, January 18th we organized an analyst lunch to discuss interesting data trends for the ‘Magnificent Seven’. Five data providers joined the session and presented to a room of fundamental analysts to share insights from their data and highlight their outlook for the coming year. This article summarizes the key takeaways of these presentations. Thank you to Apptopia, S&P Global, Extract Alpha, i360, and Facteus for participating.
For more information on attending future events or learning more about Eagle Alpha’s alternative data products and services for both data buyers and data providers, please contact us here.
Amazon using Apptopia data
Insights from Apptopia reveal mixed signals for Amazon’s various services. While Amazon Web Services (AWS) shows a 12% year-over-year growth, specific app data points are absent for this revenue line. However, App data can be applied to other areas of the business. Prime Video’s usage, often reflective of Prime membership trends, indicates a potential shortfall in subscription sales, marked by a quarter-over-quarter usage decline. Also, the Amazon Shopping app’s decreased session counts in Q4 compared to the previous year calls for a critical reassessment, despite overall strong retail sales figures. App sessions and daily active users (DAU) for shopping indicate weaker sales in Q423 with a 2% decline YoY.
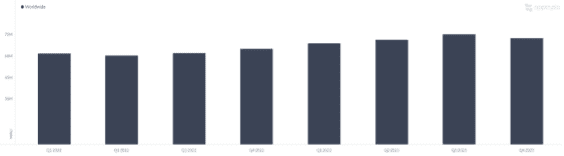
Figure 2: Amazon Prime Video monthly active users (MAUs) are down -3.5% QoQ; consensus expects 1% growth in subscription sales (Source: Apptopia)
Amazon is facing competitive pressures, especially from platforms like TikTok, which may impact its market dominance due to a decline in cross-app usage. This decrease also presents challenges for Amazon’s advertising growth, as it could restrict the company’s ability to collect extensive user data. Such data is critical for targeted advertising, a sector where Amazon has potential similar to Google’s historical growth in this domain.
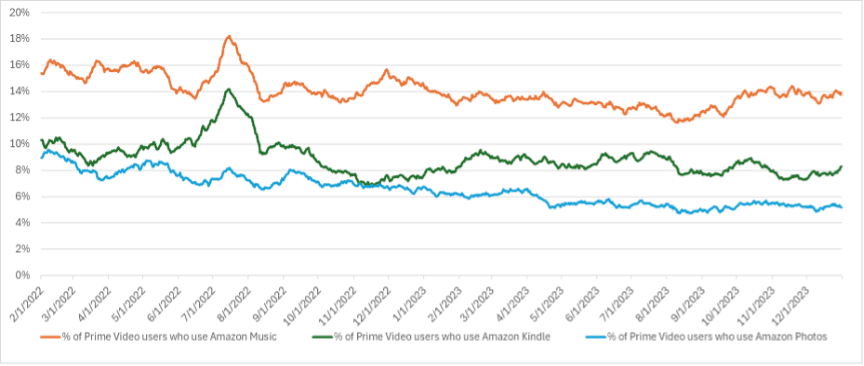
Figure 3: Prime Video users’ cross-app usage of other AMZN apps is flat-to-down over time (Source: Apptopia)
Meta using Apptopia data
Meta’s diverse app ecosystem is experiencing varied growth dynamics. Instagram, a significant revenue contributor, is showing a slowdown in its rapid growth, potentially affecting Meta’s stock value. The chart below shows a downtrend for both Instagram and Facebook into year-end. On the other hand, while a small segment of revenue, Meta for Business is thriving with a 41% rise in daily users in key markets, bolstering Meta’s revenue with strong advertising yields. Threads has also gained momentum, topping the social networking app charts due to synergies with Instagram.
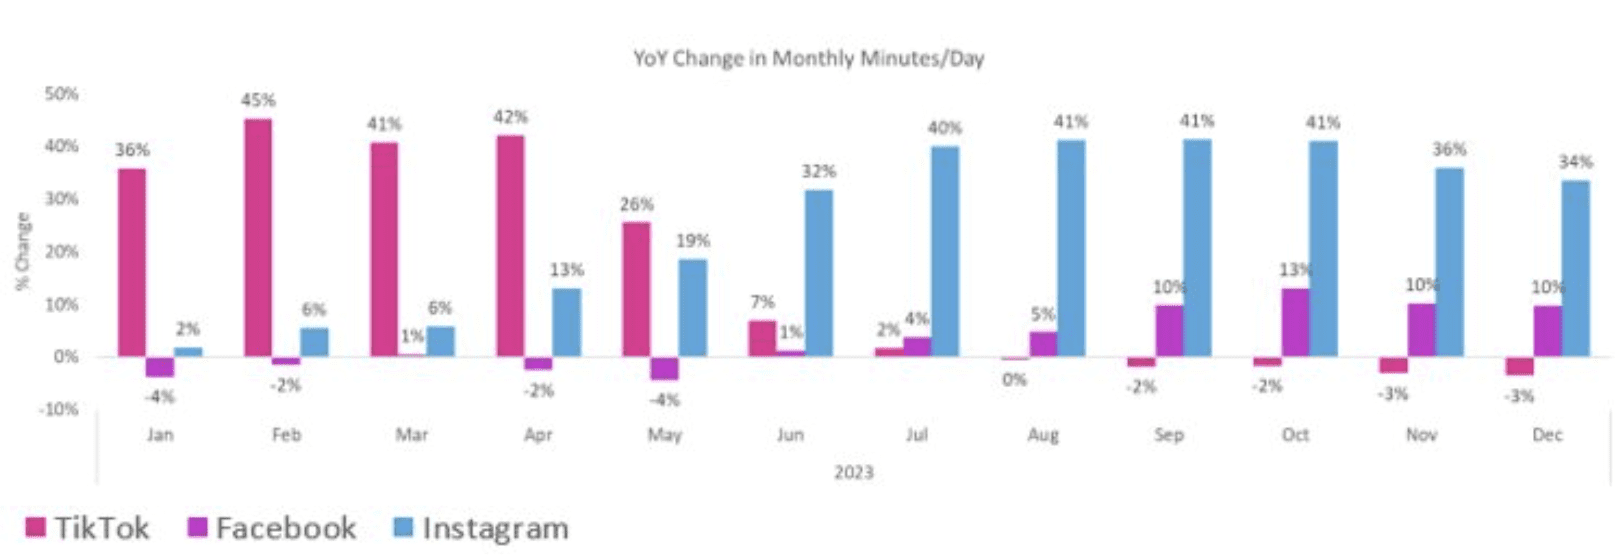
Figure 4: YoY change in monthly minutes/days (Source: Apptopia)
Looking forward, Meta’s challenge for 2024 is to sustain the expansion of its flagship platforms while leveraging the burgeoning success of WhatsApp for Business and Threads. The company’s ability to navigate the competitive landscape, particularly against rivals like TikTok, and maintain user engagement will be critical to its continued market leadership and revenue growth.
Tesla using S&P Global data
S&P Global car registration data is used to analyse consumer purchase behaviour and repeat purchases of EV vehicles. Tesla’s brand loyalty outshines other electric vehicle (EV) manufacturers, with a remarkable 77% of Tesla owners likely to purchase another EV. Rivian also has very high EV loyalty. This loyalty extends across the EV market, indicating a robust customer commitment to sustainable transportation.
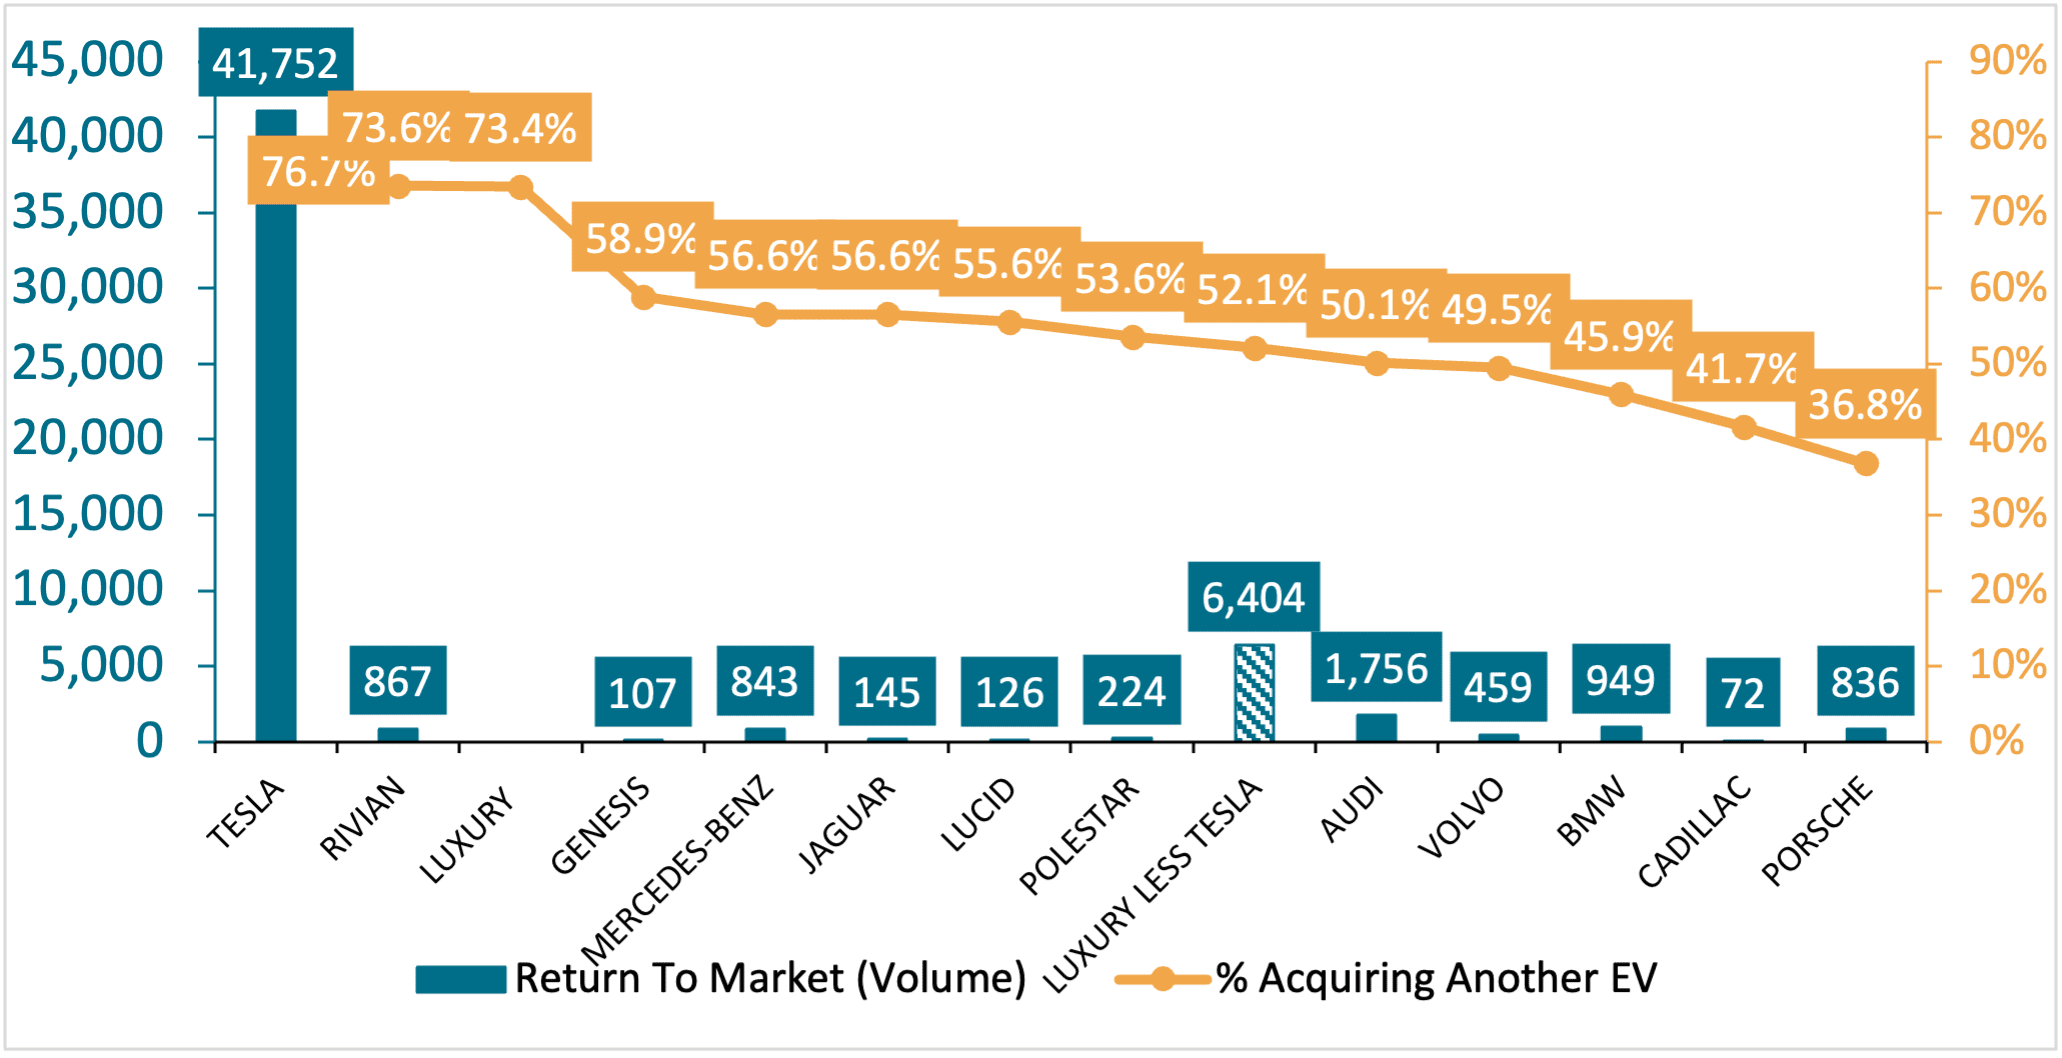
Figure 5: Electric vehicle (EV) loyalty for luxury brands ~ 50%, except…Tesla & Rivian (Source: S&P Global)
Another interesting view of S&P Global EV data shows brand loyalty across different brands. The chart below shows that approximately 90% of Tesla owners buy another Tesla when purchasing an EV. Some other interesting callouts from this data points to potential issues for Ford and Chevrolet. Both auto companies see a sharp drop off in buyers willing to buy another EV from the same manufacturer. This points to buyer dissatisfaction with their EV purchase. Another interesting point is a sharp fall off for Polestar, but S&P points out this is driven by production delays of new products rather than customer dissatisfaction.
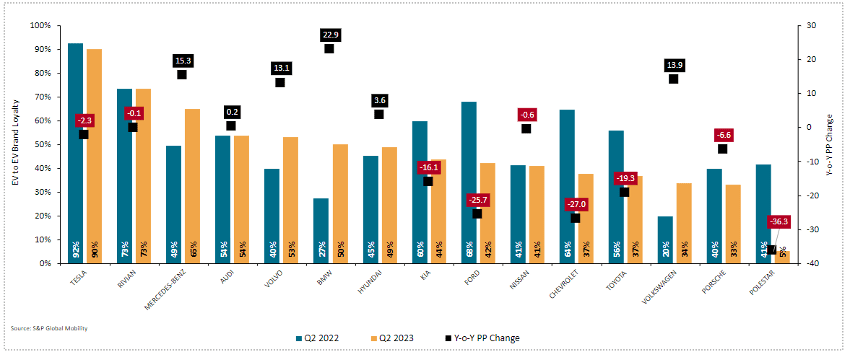
Figure 6: EV to EV brand loyalty from Q2 2022 to Q2 2023 (Source: S&P Global)
Microsoft by Extract Alpha
Extract Alpha’s ‘True Beats’ system has a strong track record in forecasting Microsoft’s financial surprises, outpacing traditional Wall Street predictions in 19 of the last 20 quarters. This suggests a potential undervalued aspect of Microsoft as a stock, considering the anticipated positive earnings surprise for the upcoming quarter as agreed upon by ‘True Beats’ and the crowd-sourced platform ‘Estimize’. This collective optimism, reinforced by individual analyst shifts in predictions and the closer-to-actual results of ‘Estimize’, underscores a broader market sentiment that may not be fully priced into Microsoft’s current stock value, indicating a positive trajectory for the company’s shares. It is important to note that both True Beats and Estimize revisions closer to the report date can have an important shorter term signal but both signals are very good medium term signals on earnings growth relative to consensus.
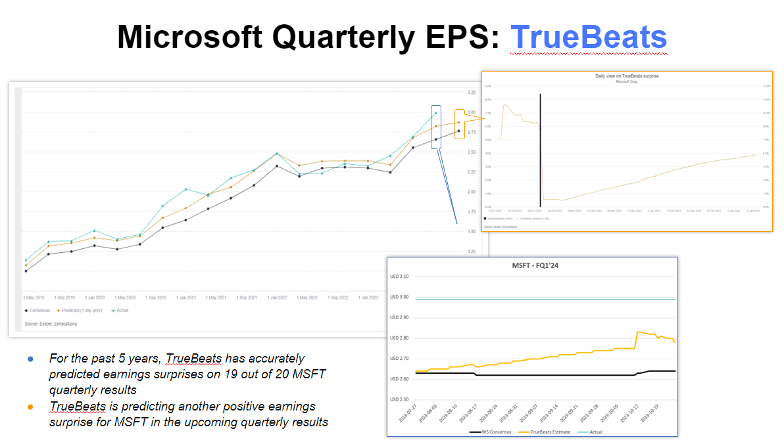
Figure 7: ‘True Beats’ is predicting another positive earnings surprise for MSFT in the upcoming quarterly results (Source: Extract Alpha)
NVIDIA using i360’s data
In 2020 NVIDIA acquired Mellonox, a company that supplies relatively low-value components for printed circuit board (PCB) connectors. Supply and demand fluctuations in the PCB supply chain can be indicative of strategic supply chain management, often suggesting preparation for potential disruptions. The Mellanox acquisition is central to NVIDIA’s data center strategy, and Mellanox sales trends can serve as a barometer for this segment’s health according to i360. Geographically, a surge in component orders in Israel aligns with Mellanox’s location, reflecting data center investment; however, a recent decline may signal a market shift or strategy realignment. While still developing, i360’s data presents a novel, if nascent, predictive lens for NVIDIA’s performance.

Figure 8: Low-value parts are bought in bulk to prevent supply chain disruptions. Israel shipments represent between 5-10% of all shipments of these PCB connectors. Growth recently turned negative YoY (Source: i360)
Apple using Facteus and i360 data
Consumer transaction data from Facteus shows Apple is experiencing positive trends among younger consumers, which is crucial for the growth of its services sector. However, the company faces the challenge of lengthening product refresh cycles, with customers holding onto devices longer.
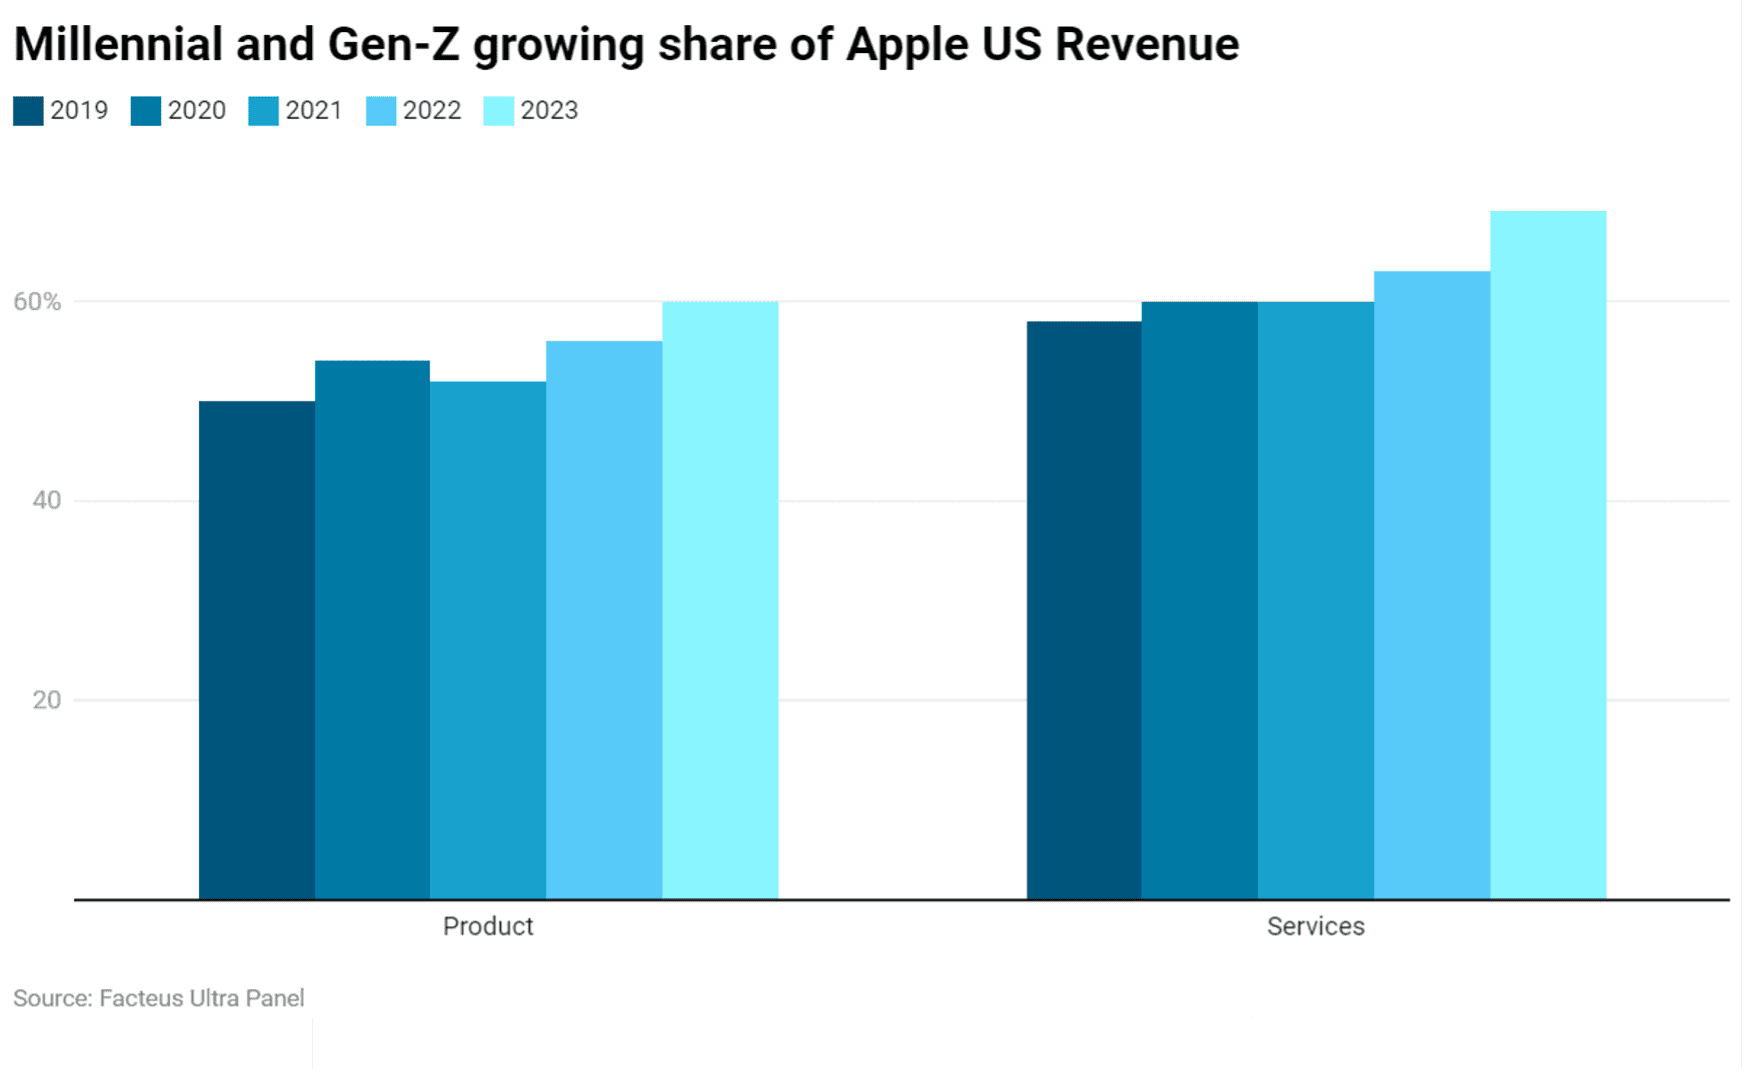
Figure 9: Millennial and Gen-Z growing share of Apple US revenue (Source: Facteus)
Despite this, Apple’s services enjoy high retention rates and increasing average spending, signaling strong customer loyalty and revenue potential. Yet, the maturation of the U.S. market poses limits to growth, emphasizing the need for innovation in services to sustain momentum and mitigate the risks associated with high baseline metrics.
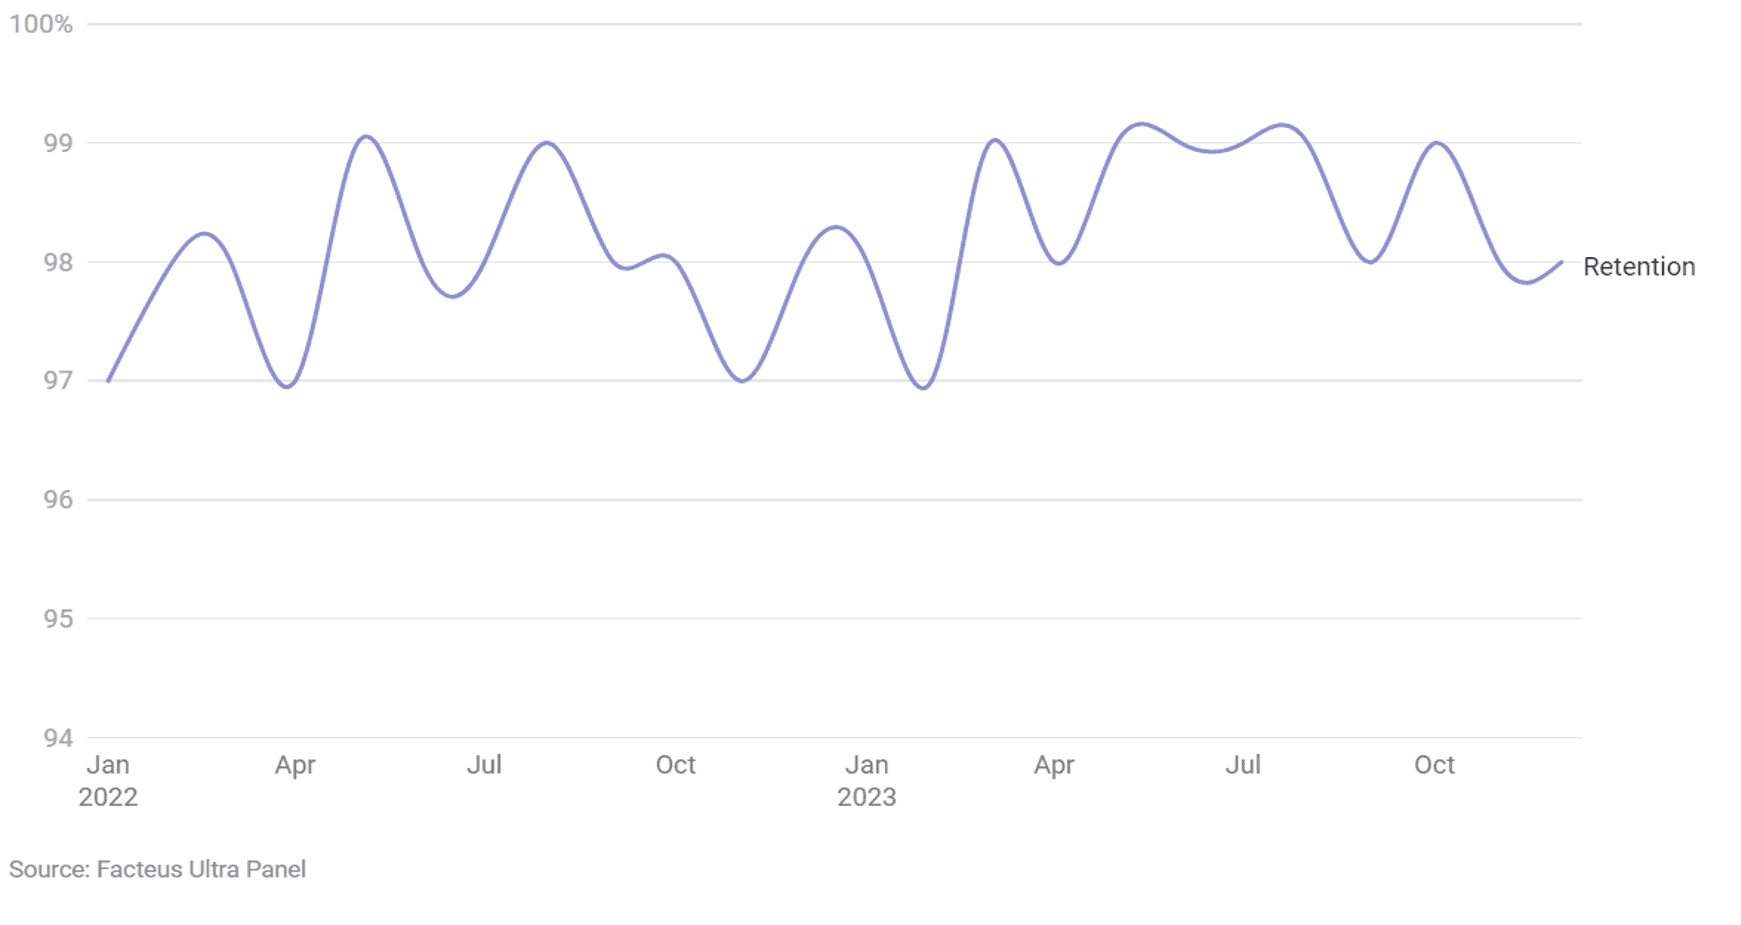
Figure 10: Apple US Services Retention Rate is Strong (Source: Facteus)
In addition, i360 Survey data serves as a good barometer of demand for Smartphones. I360 asked the question “when do you expect to buy a new Smartphone?” within the next six months and where income levels exceeded $100,000. The results correlate well with analyst consensus estimates with an overall R-Squared of 0.75.
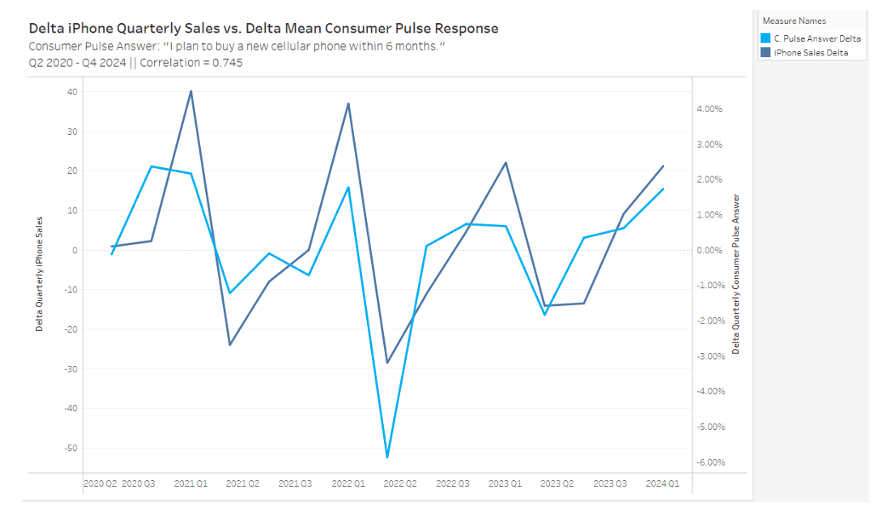
Figure 11: i360 survey results compared to analyst estimates of iPhone shipments (Source: i360)
Conclusion
The ‘Magnificent Seven’ tech companies have significantly impacted the market, adding trillions to their value, and outshining the rest of the S&P 500. With specialized data from various providers, this article highlights key trends and analyses for each of these tech giants. This ongoing analysis underscores the importance of alternative data in understanding the nuances of market trends and the health of leading tech firms especially for fundamental analysts looking for broad and holistic insights.
For more information on attending future events or learning more about Eagle Alpha’s alternative data products and services for both data buyers and data providers, please contact us here.