Tracking Supply Chain Disruptions with Alternative Data
Background
Over the past two years, alternative data sources have proven to offer hugely effective and timely insights for companies wanting to understand the impact of COVID-19. Coming into the winter holiday season, and following on from Black Friday and Thanksgiving, the cracks in the global supply chain have proven to have a devastating impact on commercial sectors, but also disrupting other sectors via a knock-on effect. Due to this, many industries are now turning to alternative data to further understand this impact.
Sources of Supply Chain Data
We recently published a client-only white paper on the topic of alternative data for supply chain analysis. We grouped the data sources into five key buckets:
- Trade (Shipping) Data: Trade data is a collection of information on ships, cargo, owners, shipbuilders, movements, fixtures, causalities, ports, and companies.
- Satellite Data: Satellite data provides information on both commodities and manufacturing plants where products and materials are traveling from, but also offers information on vessel movements and port activity for shipping data.
- Flight Data: Flight data provides end-to-end information on cargo and the movements of aircraft through alerts and tracking.
- IoT & Geolocation: While a nascent category, innovative vendors are beginning to release IoT and geolocation datasets which can be valuable for tracking the supply chain.
- Other Data for Supply Chain Tracking: Other datasets worth exploring in the context of supply chain analysis are credit datasets, ESG datasets, firmographic and reference data, NLP on public text data, and crawled data for analysis of stock-outs at online retailers.
Shipping, or trade data as it’s also known, is perhaps the most obvious and widely-used dataset category to consider when undertaking supply chain analysis. Trade data comes from government import/export data and bill of lading data at the port level. The coverage typically includes all products and commodities shipped globally. These products and commodities can frequently be tied back to individual companies or rolled up for sector insights.
Figure 1 illustrates data based on exports of Micron’s DRAM semiconductors from Korea from 2011 to 2017. In this example, one of our data partners used shipping data to monitor the trade and found that Micron’s quarterly sales correlated with the shipping data.
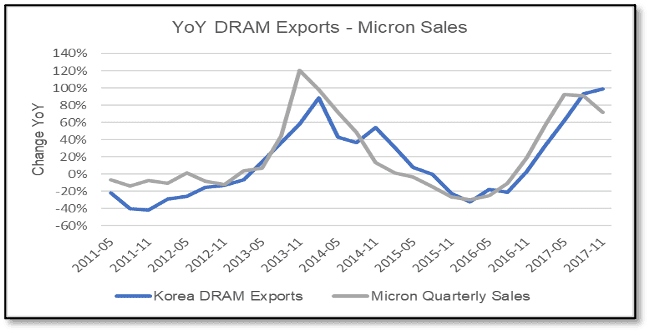
Figure 1: YoY DRAM Exports – Micron Sales (Source: Eagle Alpha Data Partner).
Companies are increasingly using satellite data to monitor supply chains. According to EY, Satellite data can be harnessed for supply chain analysis to make better choices, anticipate issues, and re-route material flows to minimize disruption. For investors, satellite data is most valuable for tracking sea freight. The value of satellite data relative to import/export data provided by trade data is that the data is more timely – often real-time. It’s possible to see in real-time if a vessel is stuck at a port like LA and how many ships are floating offshore. However, satellite data typically have narrower coverage and history is much shorter than trade data.
Figure 2 demonstrates how satellite data is being used to monitor the port of LA. The data showed the congestion much earlier than public media sources and it can be seen that the Biden Administration’s intervention in July has had little effect on the situation.
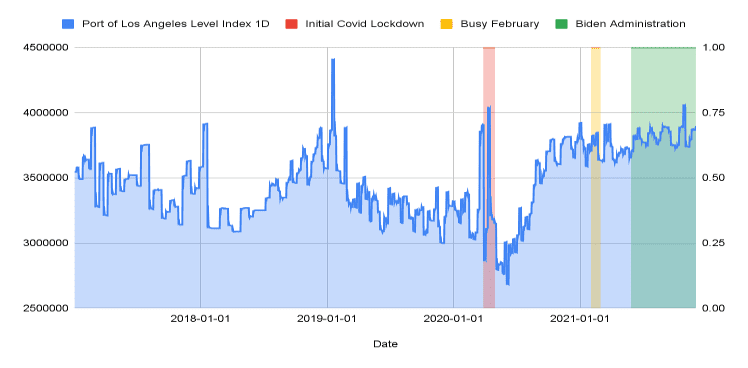
Figure 2: Satellite Tracking of Shipping Activity in the Port of LA (Source: Eagle Alpha Data Partner).
Flight data, specifically as regards cargo traffic, can be valuable for analyzing supply chain dynamics for higher value or time-sensitive goods such as pharmaceuticals, tech, and luxury goods, or items that need to be expedited. However, unlike sea freight discussed previously, it’s not possible to see “inside the container” for air freight so it’s not always clear what is being shipped.
In late 2020, a data provider specializing in high-frequency data for the air cargo industry saw a gradual recovery following Covid-19, but also that rates associated with the transportation of goods were increasing also (Figure 3).
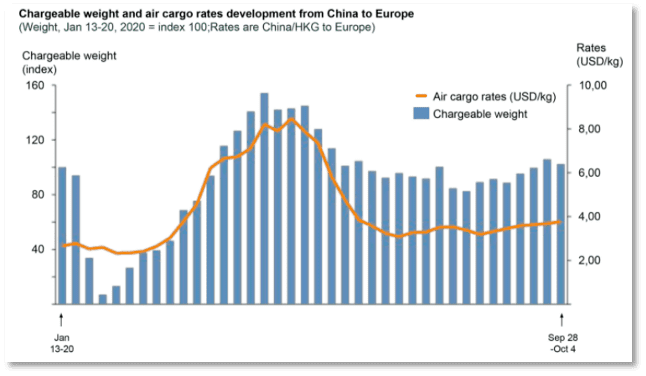
Figure 3: Rise in Volumes from China to Europe is Pushing Rates Upwards (Source: Eagle Alpha Data Partner).
IoT devices allow companies to understand where goods are, how they are being stored, and when they can be expected at a specific location. Some key examples of how IoT data benefits supply chain analysis includes authenticating the location of goods in real-time, tracking speed of movement, monitoring of storage conditions, streamlining the movement and location of goods, and validation of arrival.
Additionally, sources of alternative data namely crawled data, firmographic data, and credit and ESG data can also provide information supply chain issues.
Conclusion
Supply chain issues are predicted to continue into 2022 and alternative methods of gaining perspective on global disruptions are becoming more popular on both the investor side and on the corporate side. Asset managers are using alternative data to monitor fundamental metrics, product movement, and regional information, whereas corporates are aiming to optimize their company operations by both reducing the cost and risk associated with the supply chain.
[To request access to our data strategy portal where the full supply chain data report can be viewed click here. For further information on our products and services, you can contact inquiries@eaglealpha.com.]