Advertising Data: From Impressions to Investment Signals
Overview
Advertising data encompasses the broad set of information collected, aggregated, and analyzed to evaluate how advertising campaigns perform across channels and over time. This includes quantitative metrics such as impressions, click-through rates, conversion rates, cost per acquisition, and return on ad spend, as well as qualitative insights like audience demographics, behavioral patterns, and engagement signals.
Companies use advertising data to refine targeting strategies, tailor creative messaging, and allocate budgets more efficiently. By identifying which audiences respond best to specific messages or formats, marketers can continuously test and optimize campaigns to improve performance. Advertising data also plays a critical role in measuring the true return on investment of marketing spend, enabling teams to justify decisions, forecast outcomes, and scale successful initiatives with greater confidence.
A comprehensive understanding of the full customer journey is central to maximizing the value of advertising data. Rather than viewing individual interactions in isolation, organizations analyze how customers move across multiple touchpoints (e.g. social media engagement, search activity, display advertising, and website interactions) before reaching a conversion.
By connecting engagement on platforms like social media with downstream results from channels such as Google Ads, companies can see how early-stage awareness and mid-funnel consideration contribute to final outcomes. This end-to-end visibility allows marketers to align campaign tactics with each stage of the customer journey, reduce friction, and guide customers toward the most effective and data-supported endpoints.
The advertising analytics Market is projected to grow rapidly from USD 6.04 billion in 2025 to USD 20.33 billion by 2035, driven by increased digital advertising spend, demand for performance-based marketing, and the integration of big data and AI-powered analytics. As businesses increasingly adopt data-driven advertising strategies to track engagement and optimize ROI, factors such as evolving privacy regulations, shifting consumer behavior, and advances in predictive analytics will continue to shape the market’s development.
How Marketers Use Advertising Data
Advertising data can be used to refine and enhancing advertising strategies. Marketers may achieve improved ROI through a better understanding of campaign performance, enabling more effective budget allocation where every dollar spent contributes to the bottom line.
With real-time data, campaigns can be adjusted on-the-fly, enhancing their performance and effectiveness. data-driven decisions are facilitated by actionable insights derived from advertising analytics, ensuring strategies are based on solid evidence rather than assumptions.
Also, enhanced audience targeting is made possible by analyzing audience interactions and behaviors, allowing for more accurate targeting of ads to individuals most likely to be interested in the product or service. This increases engagement and conversion rates, maximizing the efficiency of ad spend and boosting overall campaign performance.
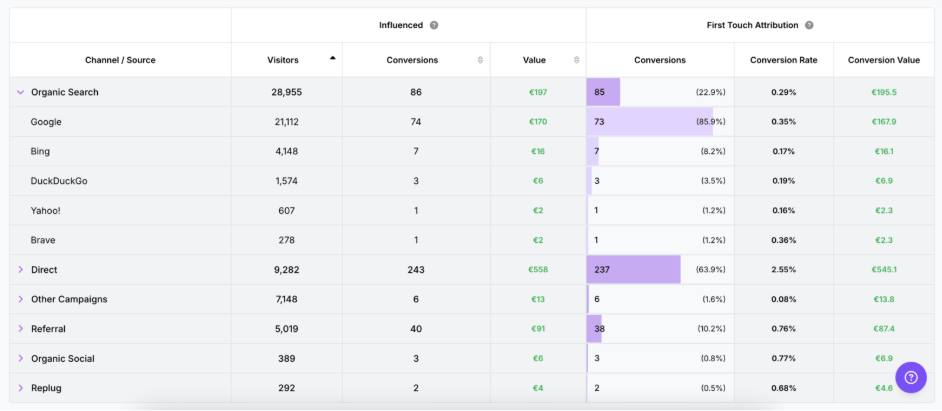
By tracing customer paths to purchase or target events, marketers can identify which ads, channels, and messages are pivotal in decision-making. This insight allows for strategic budget allocation, focusing resources on channels with the highest ROI. Figure 1 below shows an example of an ad performance attribution table.
How Asset Managers Use Advertising Data
Advertising data vendors provide investors with valuable visibility into how companies design, execute, and scale their marketing and advertising campaigns. By aggregating and analyzing data across digital channels, these vendors offer insights into advertising spend, campaign intensity, messaging strategies, and changes in promotional activity over time. This level of transparency allows investors to move beyond traditional financial statements and gain a more forward-looking view of corporate behavior.
One area where advertising data is particularly powerful is in identifying companies that may be entering a phase of accelerated growth. Increases in advertising activity or spend can signal that a company is investing aggressively to expand market share, support a product launch, enter new geographies, or capitalize on rising demand. When analyzed in context, these trends can serve as early indicators of revenue momentum, often appearing well before changes are reflected in earnings reports or guidance.
For researchers and asset managers, incorporating advertising data into the investment process can enhance company analysis and idea generation. By comparing advertising intensity across peers or tracking changes over time, investors can identify firms that are scaling faster than competitors or demonstrating confidence in future growth prospects. As a result, advertising data can be a valuable alternative data signal, helping investors identify companies with the potential to outperform the broader market.
Data Collection
There are two possible sources of advertising data – advertising data exchanges and data aggregators. Advertising data exchanges collect and analyze data on consumer interest over time based on their internet habits. This source of advertising data can be used to promote luxury goods, automotive, and certain financial services such as mortgage providers.
Advertising data exchanges often use cookies and tracking pixels placed on websites to collect information about user behavior, such as website visits, page views, clicks, and interactions with ads. These cookies and pixels track user activity across different websites and platforms, allowing the exchange to gather data on interests, preferences, and browsing habits.
Data exchanges also collect device identifiers, such as mobile advertising IDs (MAIDs) for mobile devices or unique device identifiers (UDIDs) for computers, tablets, and other devices. Device IDs enable the exchange to track user behavior across multiple devices, providing insights into cross-device usage patterns and behaviors.
Users also generate data themselves through registration forms or when creating various profiles. This data may include demographic information, such as age, gender, location, and interests, as well as preferences and behaviors indicated by users themselves.
Data aggregators, on the other hand, monitor print, television and online media to provide an estimate of success rather than exact figures. An example where this is used would be to monitor corporate messaging. Guideline, for example, provides data on how ad dollars are being spent — from television to digital, sourcing their expenditure data directly from the leading global media buying firms.
MediaRadar collects advertising data through a combination of technology and human analysis. Their methodology involves automated data collection from various digital and traditional advertising platforms, including websites, social media platforms, print publications, television, and more. Additionally, MediaRadar employs a team of analysts who manually review and verify the collected data to ensure accuracy and completeness.
Pathmatics also uses a combination of two sourcing methods: crawler- and panel-based. Their panel-based technology enables Pathmatics to track ads served to real users on their desktop browsers and within their social mobile apps via their own diverse group of panelists. And the company also employs a proprietary crawler which discovers ads by emulating the behavior of typical web visitors using a variety of devices (e.g. desktops, tablets, and mobile phones).
Adthena, on the other hand, uses a patented machine learning process combining observed data with estimated data to evaluate a given brand’s market share and trends relative to their competitors. Adthena indexes and learns from 500M advertisements per day, and each term is examined multiple times to provide an accurate view of the auction landscape it belongs to.
Academic Research
Academic researchers have long relied on advertising data to study consumer demand, brand appeal, and competitive dynamics, with more recent research extending these analyses to financial market outcomes. By examining patterns in advertising spend, exposure, and messaging, scholars are able to assess how consumers respond to brands over time and how advertising influences purchasing behavior, market share, and long-term demand trends. Increasingly, these insights are also being linked to stock returns, firm valuation, and other financial indicators, highlighting the broader economic impact of advertising activity.
Advertising plays a central role in building and sustaining brand equity, an intangible asset that strengthens a firm’s competitive position. Strong brand equity enhances product differentiation, making offerings more distinct in crowded markets, while reducing consumers’ sensitivity to price changes. This, in turn, allows firms to maintain pricing power and improve margins. Well-established brands also benefit from higher levels of consumer trust and loyalty, which can lead to repeat purchases and more stable revenue streams over time.
Beyond established products, advertising and brand equity are especially important for new product introductions. Effective advertising can lower adoption barriers by increasing awareness and credibility, making consumers more receptive to trying new offerings. Firms with strong brand equity are also better positioned to guide customers toward higher-value or more profitable products, supporting product portfolio expansion and long-term growth. Together, these dynamics explain why advertising data is increasingly viewed as a valuable lens for understanding both consumer behavior and firm performance.
McAlister and Srinivasan (2007) found that advertising and R&D expenditures create intangible assets that insulate the firm from stock market changes, thus lowering its systematic risk. Chemmanur and Yan (2019) examined the impact of advertising on stock returns over both short and long periods. The study showed that higher levels of advertising correlate with larger stock returns in the advertising year but smaller returns in the subsequent year, even after adjusting for other price predictors.
Bayer et al. (2020) examined the impact of online display advertising and paid search advertising compared to offline advertising on firm performance and value. Analyzing data from 1651 firms over seven years, the research reveals that both online display and paid search advertising contribute positively to firm performance, measured by sales, and firm value, measured by Tobin’s q.
Paid search advertising shows a stronger effect on sales compared to offline advertising, likely due to its proximity to the purchase decision and improved targeting capabilities. Conversely, display advertising has a relatively stronger positive impact on Tobin’s q, indicating its long-term effectiveness.
Liaukonyte and Žaldokas (2020) found a predictable and recurring pattern between investor exposure to television commercials and subsequent retail stock trading. In the US, different geographic locations are exposed to the same TV ads at different times. Following Apple’s advert on the east coast, a 60-70% jump in financial information searches of Apple Inc. was recorded 15 minutes after the advert was shown. Similarly, the west coast saw a 20% increase in financial searches for Apple Inc., proving there is a pattern between a successful advertisement and an investment opportunity.
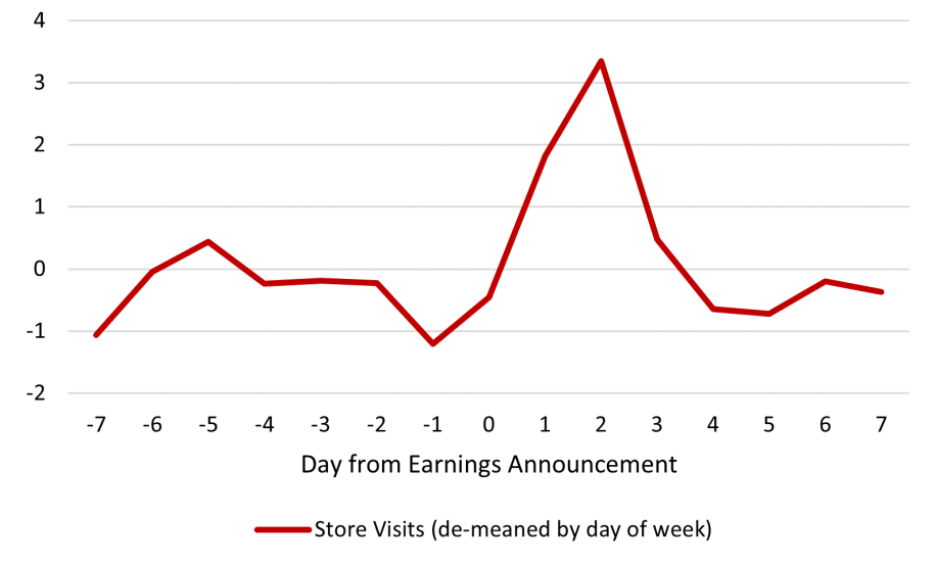
Noh et al. (2025) showed that financial reporting influenced consumer behavior by drawing increased attention to firms around earnings announcements. By analyzing GPS data, the researchers observed measurable increases in foot traffic to firms’ physical locations immediately following these announcements. The effect was especially pronounced when earnings releases received significant media coverage, faced less competition from other simultaneous announcements, generated higher levels of online search activity, or triggered large stock price movements and earnings surprises.
The findings further showed that consumer responses varied by firm characteristics. For companies selling durable goods, positive earnings announcements were associated with particularly strong increases in foot traffic, suggesting that consumers interpreted favorable financial results as a signal of product quality or long-term firm viability. This heightened attention translated into tangible business outcomes, including increased revenues and improved advertising effectiveness.
Case Studies
How Google’s AI Overviews are changing the game for PPC and Google Ads
AI features such as AI Overviews (AIOs) and AI Mode are transforming Google Search by enabling more complex queries and increasing user engagement. While concerns have emerged about declining website traffic, Google reports that overall organic clicks remain stable and click quality has improved, as users who do click are more engaged. As search behavior evolves, traffic is shifting toward sites that offer in-depth, authentic, and original content.
Adthena confirmed that the prominent placement of AI Overviews made them highly disruptive as ads and organic results are often pushed below the fold. This shift is forcing advertisers to rethink how they maintain brand presence and capture demand in search. The displacement of ads has had direct implications for Google Ads performance and auction dynamics. Fewer premium placements above the fold have led to declining click-through rates and engagement.
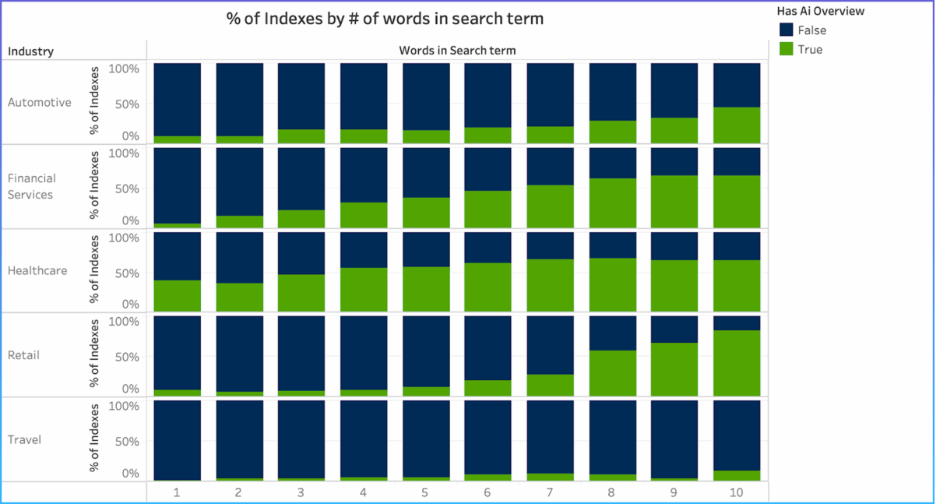
The impact of AI Overviews varies significantly by industry. Healthcare has seen the highest saturation, with AI-generated summaries appearing frequently across both short and long queries, including branded searches. Financial Services and Automotive are also experiencing growing AIO presence, primarily on generic and informational queries. Retail and Travel, by contrast, currently see fewer AIOs, mostly on longer, more complex search terms.
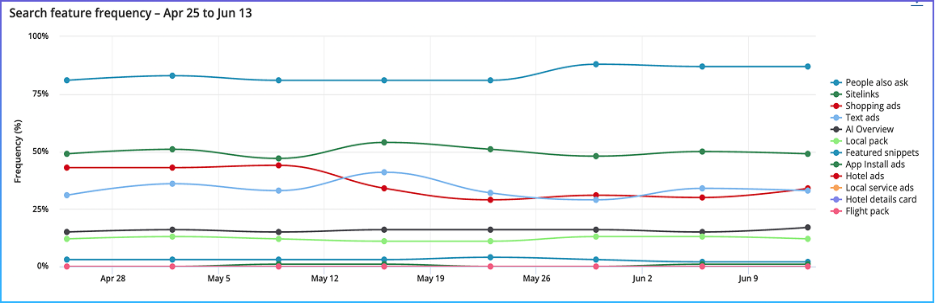
Adthena’s Search Landscape dashboard gives analysts visibility into how Google’s search result pages are evolving. The dashboard provides a live, tailored view of page changes within a specific market, providing insights on which features are gaining prominence and which are declining across the most important keywords and competitors.
By contextualizing performance data, the Search Landscape dashboard helps analysts explain fluctuations in traffic, impressions, and conversions that might otherwise appear confusing or unexplained. Instead of optimizing campaigns in isolation, teams can directly connect shifts in visibility to changes in result pages’ composition, such as AI Overviews pushing ads below the fold or new vertical features overtaking traditional placements.
Advertising Data Revealing Brand Strategy
Sensor Tower is a market intelligence firm that specializes in analyzing digital advertising activity across mobile, social, and streaming platforms to help investors, brands, and analysts understand how companies deploy advertising spend and how those strategies evolve over time. Using proprietary panels and data science models, Sensor Tower estimates ad spend, channel allocation, creative strategy, and advertiser behavior, providing a real-time view into how brands compete for consumer attention across industries.
A core strength of Sensor Tower’s advertising data is its ability to track shifts in spending intensity and timing around key commercial moments. For example, in the consumer-packaged goods (CPG) sector, Sensor Tower data shows how brands significantly ramp up ad spend in the weeks leading up to major events like the Super Bowl, while non-participating brands increase spend at a far slower pace.
In 2024, there were five debut CPG Super Bowl advertisers that included CeraVe, Lindt, Nerds, poppi, and Starry. These debut advertisers saw the largest spike in Google search trends during the week of the Super Bowl. US digital ad spend across the group was up 160% compared to its average spend throughout the rest of 2024, which suggests that these brands are also investing in driving awareness through multiple touch points outside of their singular Super Bowl commercial.
Sensor Tower’s data also showed that returning Super Bowl advertisers within the CPG industry spent 30% more on US digital ad spend throughout 2024 than debut advertisers. Despite returning advertisers’ increased US ad spend throughout the year, in the four weeks leading up to Super Bowl in 2024, they spent 40% less than their debut advertising counterparts, which suggests that these repeat advertisers could further leverage the opportunity afforded by their Super Bowl investment.
Interestingly, CPG advertisers that run Super Bowl ads typically increase their US ad spend in the weeks leading up to the big game vs the broader CPG category. They also allocate a higher portion of their budget to video-led social media platforms, primarily YouTube and TikTok, up 9ppts and 6ppts vs the broader category, which suggests that these companies are redistributing their Super Bowl commercials across multiple platforms to increase viewership.
Beyond CPG, Sensor Tower’s advertising intelligence extends into streaming and social media ecosystems. Netflix’s expansion into advertising has marked a significant shift in the streaming and digital advertising landscape, and Sensor Tower’s data provides a clear lens into how this transition is unfolding. As Netflix scaled its ad-supported offering, it rapidly attracted advertisers across a wide range of verticals, transforming the platform from a purely subscription-driven service into a meaningful destination for brand and performance advertising.
Sensor Tower data shows that financial services advertisers have emerged as a major driver of Netflix ad spend growth, recording the largest year-over-year increase in spend share in recent quarters. This shift highlights how traditionally conservative advertisers are becoming more comfortable with premium streaming environments, particularly as Netflix offers access to large, engaged audiences at scale. Telecom, food and dining services, and health and wellness brands have also increased their presence, signaling broad-based adoption and growing confidence in Netflix as an effective advertising channel.
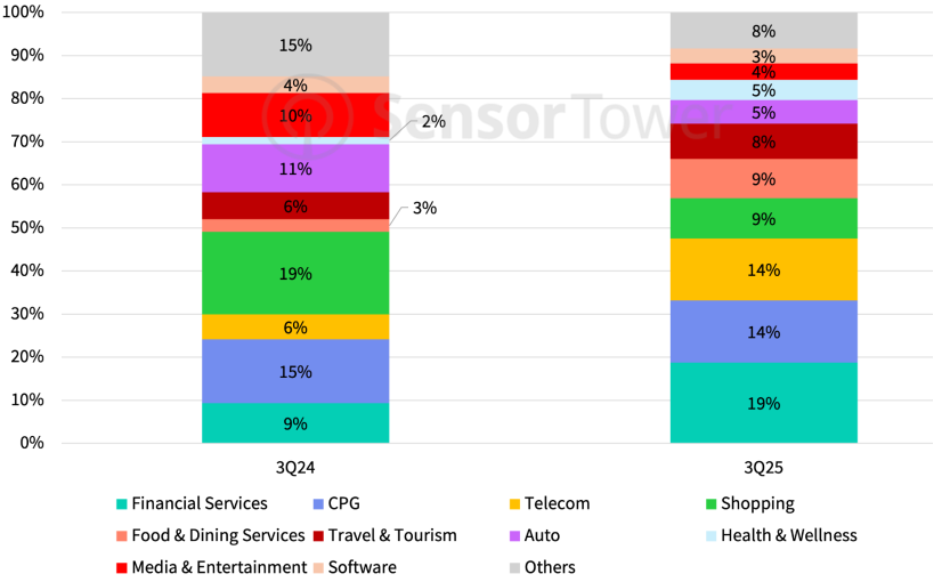
By analyzing advertiser rankings and spend concentration, Sensor Tower illustrates how Netflix’s ad ecosystem is becoming increasingly competitive. Financial services firms now represent the largest advertising vertical on the platform by spend, a sharp rise from prior years when categories like CPG and entertainment were more dominant. This reordering of advertiser priorities provides insight into how different industries are reallocating budgets away from traditional digital channels and toward connected TV and streaming, where brand-safe environments and high-quality content are key differentiators.
Winning Share of Voice in a Challenging Retail Environment
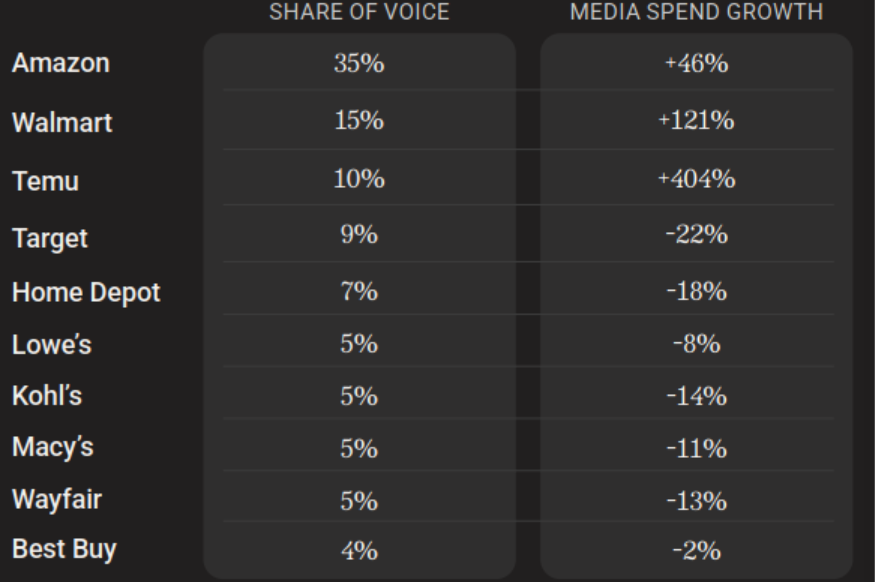
MediaRadar’s data showed how leading U.S. retailers are reshaping their advertising strategies in response to a more challenging and competitive market environment. By analyzing media spend and share of voice across major retail brands, the data highlighted clear differences between established market leaders and emerging challengers. Advertising behavior emerged as a critical signal of which retailers were willing to invest aggressively to defend or expand their position, even as broader industry conditions softened.
MediaRadar’s data highlighted Amazon and Walmart as dominant players with the largest share of voice, while Temu stood out as a rapidly rising advertiser. Temu’s advertising investment grew dramatically year-over-year, allowing it to capture meaningful visibility despite being a newer entrant. This contrast illustrated how aggressive spend growth can quickly elevate a brand’s presence and challenge incumbents, particularly when competitors are pulling back.
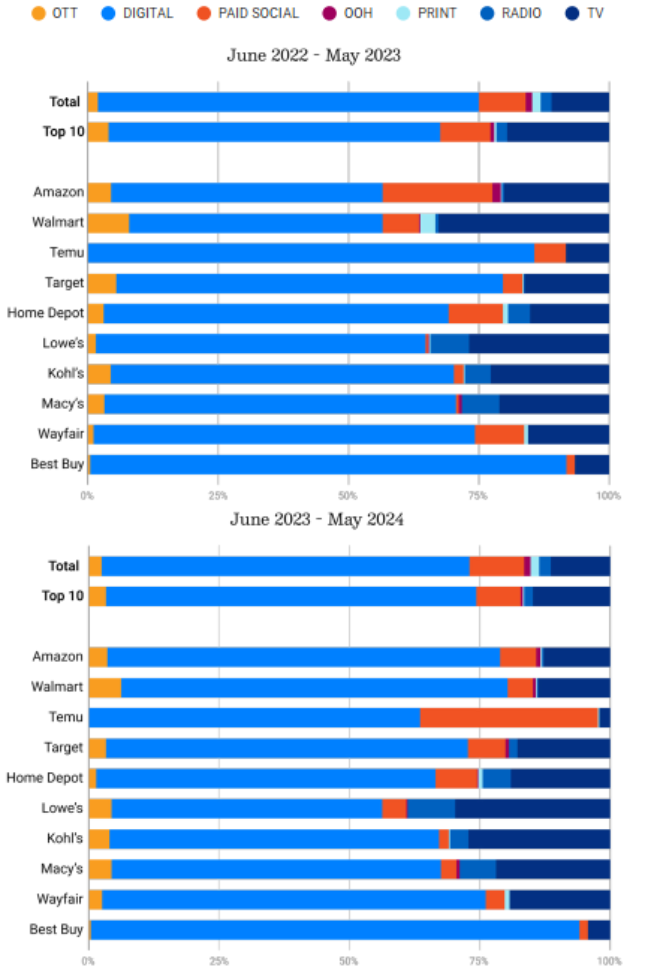
The data showed that digital advertising dominated retail media strategies across the board. Retailers concentrated budgets in digital channels that perform well close to the point of purchase, using them to influence increasingly price-sensitive consumers. MediaRadar’s analysis revealed that price-focused messaging appeared in a significant share of digital ads, underscoring how retailers leaned into value and affordability to resonate with shoppers under economic pressure.
MediaRadar’s data also revealed wide variation in how retailers allocated and reallocated their media budgets. Some brands adhered closely to industry norms, while others deliberately deviated. Temu emerged as one of the most distinctive advertisers, heavily prioritizing paid social channels and rapidly shifting spend year-over-year. Even large incumbents such as Amazon and Walmart demonstrated notable flexibility, reallocating substantial portions of their budgets rather than maintaining static media mixes.
Conclusion
Advertising data has become a critical lens through which marketers, investors, and researchers can better understand consumer behavior, competitive dynamics, and firm performance. Across channels and formats, these data illuminate not only how campaigns perform, but how attention is captured, brand equity is built, and demand is shaped over time. By connecting granular engagement signals to outcomes such as conversions, revenue, and market share, advertising data enables more informed decision-making and more efficient allocation of marketing spend.